

New updates to the ETE Metrics page present the latest available data (through 2018) for both New York State and New York City, showing progress to date towards the official NYS Ending the Epidemic Initiative targets. In addition to displaying New York City data for the first time on the ETE Metrics page, we have launched a new feature to view these annual data by race/ethnicity.[1]
Although data for calendar year 2020 will not be released until late 2021, the ETE Dashboard now has four full years of data (2015-2018) since the ETE Blueprint was released to learn from.
- New HIV infections (incidence): The estimated number of new HIV infections in 2018 in New York State was 2,019, an 11% decrease from 2017 using the updated methodology for incidence estimation.[2]
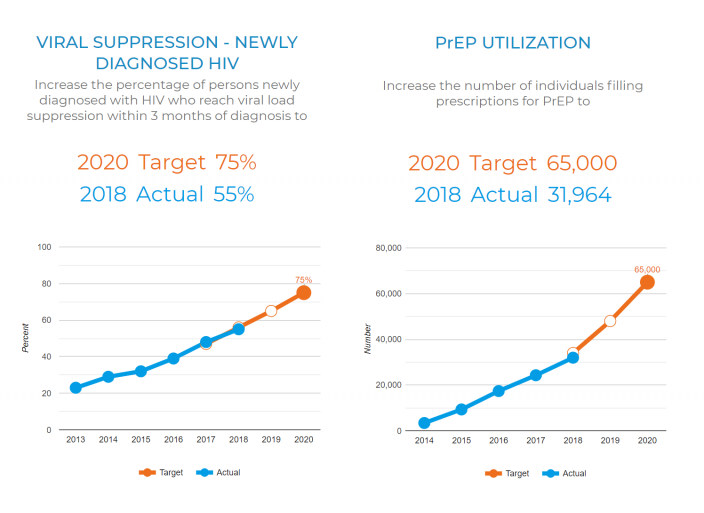
- New HIV diagnoses: In 2018, there were 2,481 persons with newly diagnosed HIV in NYS, slightly higher than the 2018 target of 2,253. Among this population, 82% were linked to care within 30 days of diagnosis and 55% reached viral load suppression within 3 months, both nearing their yearly targets (see figure) and representing an upward trend towards the 2020 goals of 90% linked and 75% virally suppressed.
- PrEP utilization: In 2018, 31,964 individuals filled prescriptions for PrEP in New York State, yet only 8,085 of those were Medicaid recipients.[3]
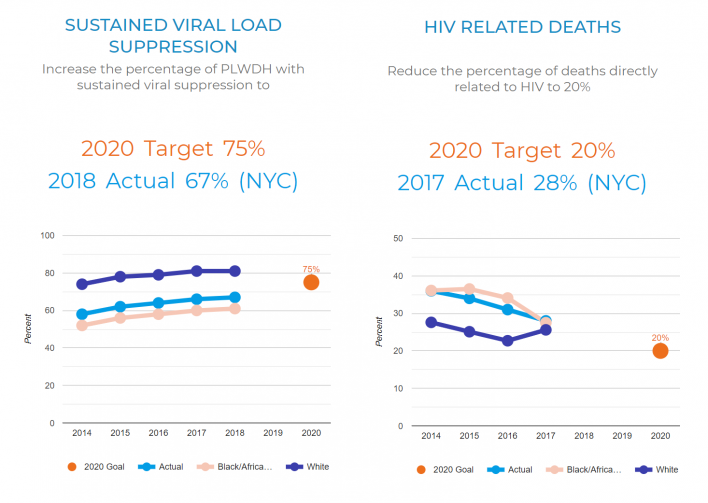
While many of the outcomes displayed across our ETE Metrics page present progress towards achieving the goals of ETE, notable disparities persist among both persons with newly diagnosed HIV and among all persons living with diagnosed HIV (PLWDH). For example, in New York City in 2018 among PLWDH, whites were more likely to have sustained viral load suppression (81%) than both Hispanic/Latino (67%) and Black/American-American (61%) persons. To draw focus on these disparities, we’ve included a new filter feature that allows users to view the data by race/ethnicity in New York City for most metrics (see figure). The ETE Dashboard team is currently developing additional visualizations to highlight disparities in HIV-related outcomes and plans to include this new filter feature for statewide data on subsequent updates.
Explore all of these metrics and data for both New York State and New York City on the updated ETE Metrics page.
For a summary snapshot of select metrics at a glance, view/download our ETE Dashboard Metrics infographic below.

These Footnotes Will Help You Explore the Data:
[1] Race/ethnicity filters are currently only available for NYC level data, but we are working to add this feature to the NYS page view on future updates.
[2] Data for this metric are produced using a CDC method and associated program that were introduced in 2017 (Song R, et al., 2017). Using this new method to estimate HIV incidence, the new 2020 target has been updated from 750 to 1000, as estimates are on average 32% higher than the old method used at the time ETE goals were established.
[3] Source: IDV (Integrated Dataverse) from Symphony Health and the NYS Medicaid Data Warehouse (MDW)

The Ending the Epidemic (ETE) Dashboard was designed and developed by the Institute for Implementation Science in Population Health at the CUNY Graduate School of Public Health & Health Policy of the City University of New York. The purpose of the ETE Dashboard is to measure, track and disseminate actionable information on progress towards achieving New York State’s Ending the Epidemic Initiative’s goals to all interested stakeholders.The ETE Dashboard project is funded by the New York State Department of Health AIDS Institute.


Comments
Comments